The SnailWorks system is very easy to navigate, but you can dig down into overwhelming detail if you are so inclined. That is the beauty of the system – it fits a variety of needs. It’s easy but powerful. How you choose to use the system is entirely up to you, or course, but there are a few basic reports that many clients use regularly, and we think they offer a good approach to getting the best value out of tracking.
The most popular doesn’t even require you or your clients to log in. You can have a report in your email every day that shows you the delivery progress of all your active jobs. This is the Daily Delivery Report. You can set up your account so that each of your clients receive their report every day – and you get a report for all your clients’ mailings. It is a great “set it and forget it” feature. Once set, each new job will automatically be included in this report.

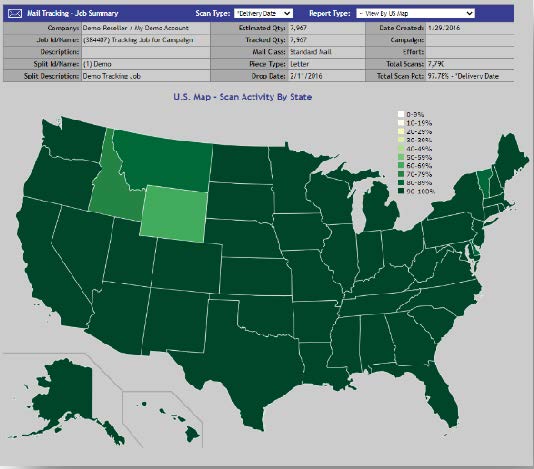
For online use, the first report you see when you log into a mailing is generally either a Heat Map of the country – deeper greens mean more mail delivered – or Mail Piece Counts by Delivery Date report. You can configure which report you and your clients want to see first. For national mailings, a map may well make sense, while for local mailings the map may not be as helpful as the Counts by Delivery Date. (Your Project Manager can help you configure yours.) Either of these provide an excellent quick view of what is going on overall with a mailing.


If everything with a mailing is meeting expectations, you may be able to stop right there. If you see a state in a shade of green you don’t like or – Heaven forfend – yellow, you can mouse over the state to get basic statistics. If you still don’t like what you see, you can click the state to drill down to three-digit reporting and keep drilling down to the single-piece level as needed to see what’s going on. At the single-piece level you’ll be able to see all the steps your piece went through to delivery – this can give great insight into other pieces.
These basic reports give you a good idea of what is happening to your mailing overall. When you see trouble, or something you don’t quite understand, our customer service team stands ready to help you dig in and figure it out.
Most of our clients love to take advantage of scheduled reports. These can be set up for some, or all jobs, and can report on virtually everything you see on the web. You can easily share these reports with clients, production staff – anyone you choose. The most popular scheduled reports are:
- The Daily Delivery Report
- ACS Data Reports
- Informed Delivery Summary (or detail)
- Container Tracking and Exception Reports
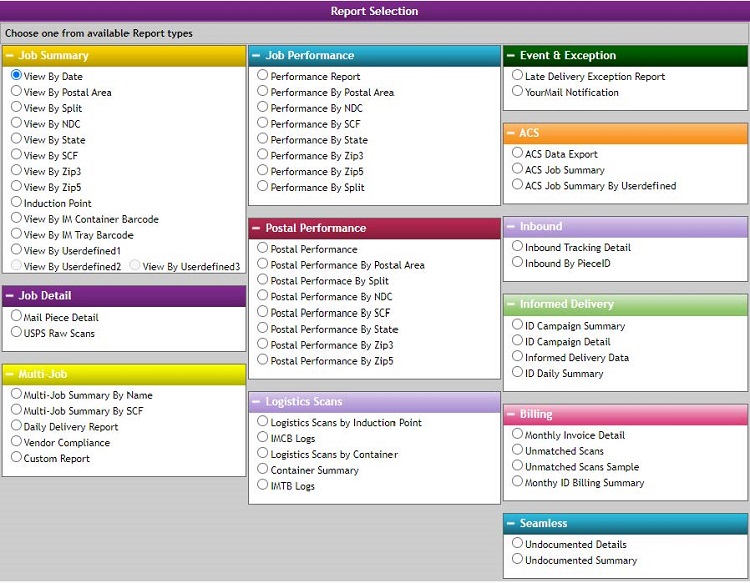
Those may be the most popular, but the full list is available on the reports page in each SnailWorks job.

Look at all them reports!
Want to learn how to use these reports and any other? Contact your Project Manager, or any of us at SnailWorks – we’ll show you how to make them yours!